Tutorial
DiagramDigitizer can be started from Anaconda prompt by
diagramdigitizer
or from Python prompt by
>>> import diagramdigitizer
>>> diagramdigitizer.diagramdigitizer.run()
When starting DiagramDigitizer, the main window is displayed as shown in Figure 1.

Figure 1: Main window of DiagramDigitizer: Navigation menu (1), digitization area (2), and secondary navigation (3). If a submenu has been entered, the secondary navigation contains a Back button, which allows to reach the navigation menu from the respective submenu (see e.g. Figure 2).
It consists of the navigation menu, the digitization area, and the secondary navigation.
The navigation menu contains the following submenus:
Project: Start a new project, load an existing project from file or save the current project status to a file.
Axes: Define the axes limits (x0, x1, y0, y1) as well as axes scales (linear/logarithmic).
Data: Digitize each curve within the diagram.
Export: Process data (ordering, interpolation) and export the numerical data to different file types (Text, CSV, Excel).
Info: Info.
Quit: Exit DiagramDigitizer.
Navigation within DiagramDigitizer proceeds always via the navigation menu, which can be reached from each submenu using the Back button in the secondary navigation (see e.g. Figure 2).
Project
In this submenu, the user has the following options:
New Project: Start a new project by opening an image file which contains the diagram to be digitized.
Load Project: Load an existing project from file.
Save Project: Save the current project status to a file.
Axes
In this submenu, the axes of the diagram can be defined.
Definition of an axis limit (e.g. x0) is possible by activating the corresponding button (see Figure 2), entering the corresponding value and placing the axis limit within the digitization area (containing the diagram) by mouse using the left mouse button. The placed axis limit can be removed using the right mouse button. In order to change the place of an existing axis point, the corresponding button has to activated and the respective new axis point can be placed using left mouse button.
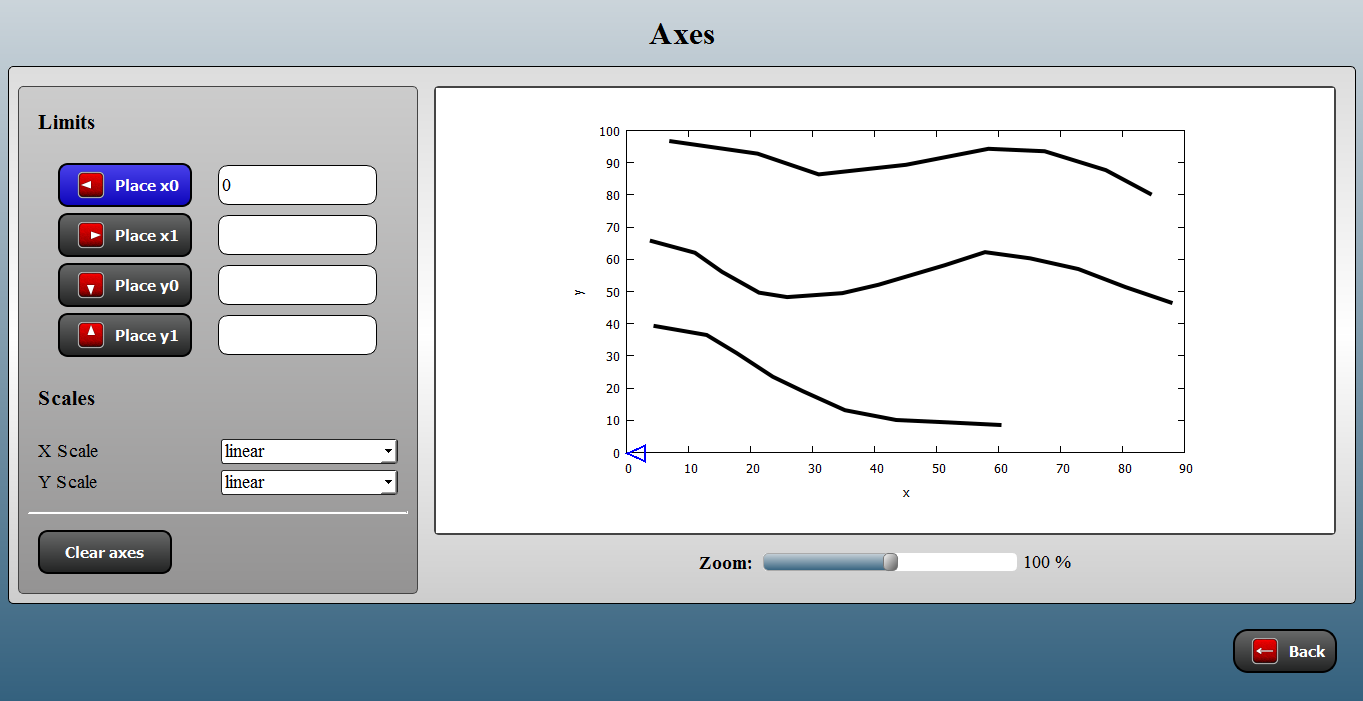
Figure 2: Submenu Axes of DiagramDigitizer: Defining an axis limit (here: x0 - the corresponding axis limit button is active).
Once the axes definition has been completed, the axes are shown within the diagram (see Figure 3). The axes definition can be cleared using the Clear axes button.

Figure 3: Submenu Axes of DiagramDigitizer: Completed axes definition.
In addition, the scale of each axes can be set: linear or logarithmic scale.
Data
In this submenu, the actual data extraction can be done.
The data is organized in data sets in the same way as a typical diagram contains several curves/lines. In order to extract data from one curve, add a new data set using the New data set button and digitize the curve by mouse (left mouse button). An axis point of the active data set can be removed using the right mouse button. The user can switch between the different sets to add/remove data points or remove a data set (see Figure 4).

Figure 4: Submenu Data of DiagramDigitizer: data extraction.
The actual coordinates within the diagram are displayed as well in order to support the digitization procedure.
Export
In this submenu, the user can export the numerical data to various output formats (Text, CSV, and Excel) for further use.
Special feature: The Excel sheet additionally contains a chart with the digitized data points (see Figure 5).

Figure 5: Excel export.
The data may be processed before export: sorting of data points within each set as well as interpolation of the data points.